What NYC homeowners actually pay: effective property tax rates by borough and ZIP code
Computed October 3, 2026 from 1,411,696 one- to three-family tax lots on the city’s assessment roll (roll year 2027), FY2026 Class 1 rate (19.8433%) applied. Recomputed daily.
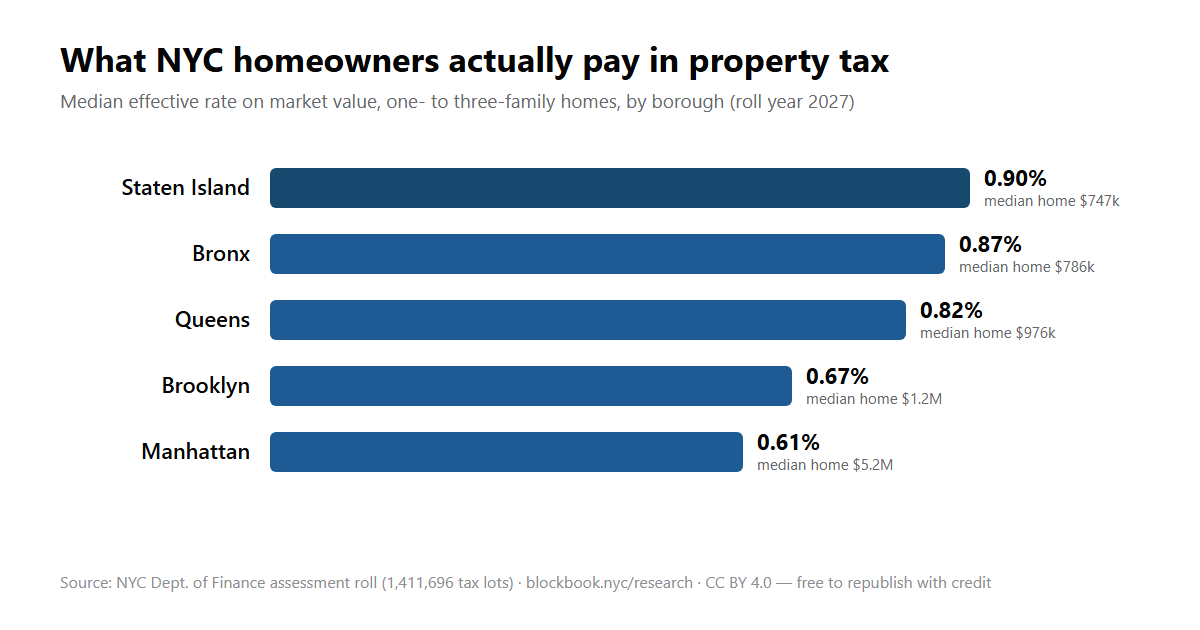
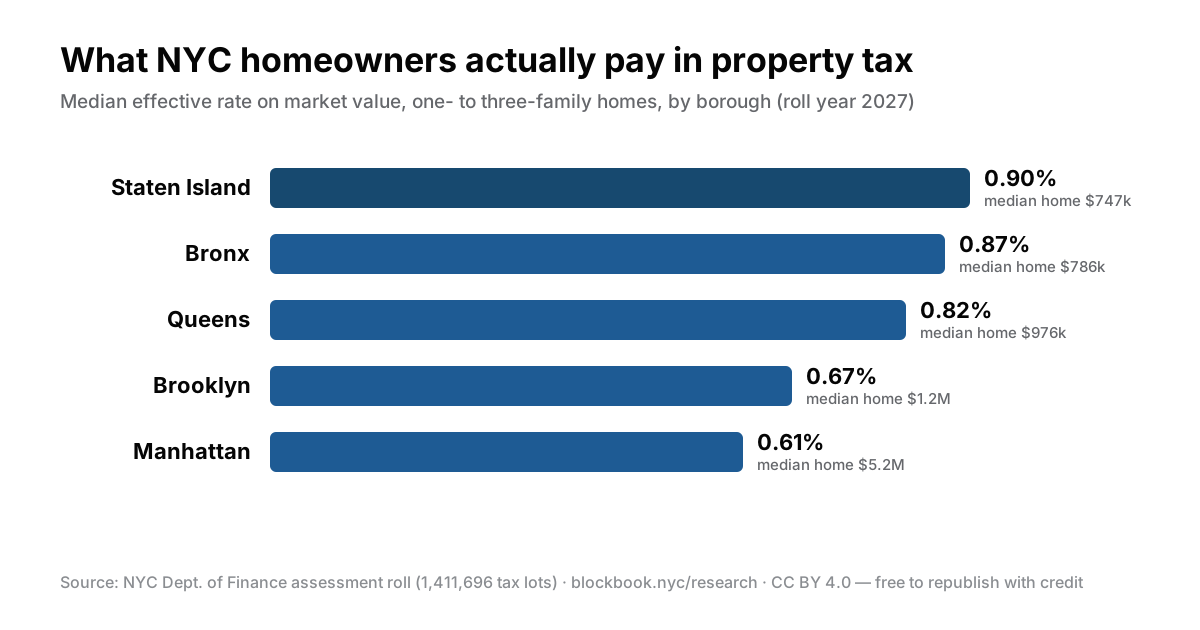
New York City charges every one- to three-family home the same nominal tax rate — but what owners actually pay relative to what their home is worth varies enormously. The median homeowner in Staten Island pays an effective 0.90% of their home’s value each year, while the median homeowner in Manhattan — where homes are worth 6.9× more — pays just 0.61%. The city’s least expensive boroughs carry effective rates about 1.5× higher than its most expensive one.
Effective tax rate by borough (Class 1 homes)
| Borough | Median home value (DOF) | Median annual tax | Effective rate | Homes counted |
|---|---|---|---|---|
| Manhattan | $5,167,000 | $30,667 | 0.61% | 13,089 |
| Brooklyn | $1,221,000 | $7,687 | 0.67% | 431,730 |
| Queens | $976,000 | $7,985 | 0.82% | 581,794 |
| Bronx | $786,000 | $6,706 | 0.87% | 137,652 |
| Staten Island | $747,000 | $6,789 | 0.90% | 247,431 |
Why are Staten Island property taxes higher than Manhattan’s?
Because state law caps how fast assessments can grow, and Manhattan home values have outrun the caps. Staten Island homeowners pay an effective 0.90% of market value each year versus 0.61% in Manhattan — even though the median Manhattan home is worth 6.9× more (BlockBook NYC analysis of 1,411,696 Class 1 tax lots, roll year 2027).
Why identical rates produce unequal bills
State law caps how fast a Class 1 assessment can grow: no more than 6% a year or 20% over five years, regardless of what the home is actually worth. In neighborhoods where values have climbed fastest — brownstone Brooklyn, much of Manhattan — assessments have fallen far behind the statutory 6% of market value, shrinking the effective rate. Where values grew slowly, assessments kept up, and owners pay closer to the full rate. The result: the caps intended to protect homeowners systematically favor the owners of the fastest-appreciating homes.
The 12 highest-taxed ZIP codes
| ZIP | Borough | Median home value | Effective rate | Homes |
|---|---|---|---|---|
| 11004 | Queens | $893,000 | 1.03% | 4,781 |
| 10471 | Bronx | $1,188,000 | 1.00% | 3,812 |
| 10464 | Bronx | $718,000 | 0.97% | 2,840 |
| 10309 | Staten Island | $849,000 | 0.97% | 19,262 |
| 10307 | Staten Island | $921,000 | 0.96% | 7,994 |
| 11001 | Queens | $858,000 | 0.96% | 2,392 |
| 11426 | Queens | $813,000 | 0.96% | 8,579 |
| 10465 | Bronx | $747,000 | 0.95% | 15,805 |
| 10308 | Staten Island | $752,000 | 0.95% | 16,628 |
| 10312 | Staten Island | $789,000 | 0.94% | 36,904 |
| 11364 | Queens | $1,166,000 | 0.93% | 12,430 |
| 11362 | Queens | $1,146,000 | 0.93% | 7,834 |
The 12 lowest-taxed ZIP codes
| ZIP | Borough | Median home value | Effective rate | Homes |
|---|---|---|---|---|
| 11238 | Brooklyn | $2,751,000 | 0.26% | 5,386 |
| 11205 | Brooklyn | $2,501,000 | 0.27% | 3,176 |
| 11215 | Brooklyn | $2,987,000 | 0.27% | 12,406 |
| 11211 | Brooklyn | $2,333,500 | 0.27% | 5,096 |
| 11231 | Brooklyn | $2,927,000 | 0.27% | 6,067 |
| 11217 | Brooklyn | $3,548,000 | 0.28% | 4,894 |
| 11222 | Brooklyn | $2,448,000 | 0.29% | 4,846 |
| 11216 | Brooklyn | $1,935,000 | 0.29% | 7,357 |
| 11221 | Brooklyn | $1,501,000 | 0.29% | 12,952 |
| 11206 | Brooklyn | $1,801,000 | 0.31% | 4,171 |
| 11233 | Brooklyn | $1,292,000 | 0.34% | 11,920 |
| 11201 | Brooklyn | $5,132,000 | 0.36% | 3,023 |
ZIP codes with fewer than 2,000 Class 1 homes are excluded.
Methodology
- Universe: every Class 1 (one- to three-family) tax lot on the current NYC assessment roll with a positive DOF market value.
- Effective rate: the median of each home’s taxable value ÷ DOF market value, multiplied by the official FY2026 Class 1 rate (19.8433%). Median-of-ratios, not ratio-of-medians.
- Values: the Department of Finance’s own market-value estimates — typically below open-market sale prices, and applied consistently across boroughs. Taxable values are as they appear on the roll (after caps and exemptions baked into assessments; before personal credits).
- Sources: Property Valuation and Assessment Data and Property Tax Rates by Tax Class, NYC Open Data. Queried live; figures recomputed daily.
- Scope note: condos and co-ops (Class 2) are valued by an income approach that isn’t comparable to sale prices, so they’re excluded here; a price-matched Class 2 study is future work.
Free to republish — tables, charts, and figures — with attribution and a link (CC BY 4.0):
BlockBook NYC, “What NYC homeowners actually pay: effective property tax rates by borough and ZIP code,” computed October 3, 2026 from NYC Open Data. https://www.blockbook.nyc/research
Download the full dataset (CSV) — every borough and qualifying ZIP code, at a stable URL. Chart, ready to embed: PNG · SVG.
Need a custom cut — by neighborhood, class, or for a specific story deadline? Email info@nycblockbook.com.
See any specific home’s numbers with the property tax lookup, or the borough pages: Manhattan · Brooklyn · Queens · Bronx · Staten Island.